
What's new in Plotera: a living 3D garden, harvest charts and simpler soil tests
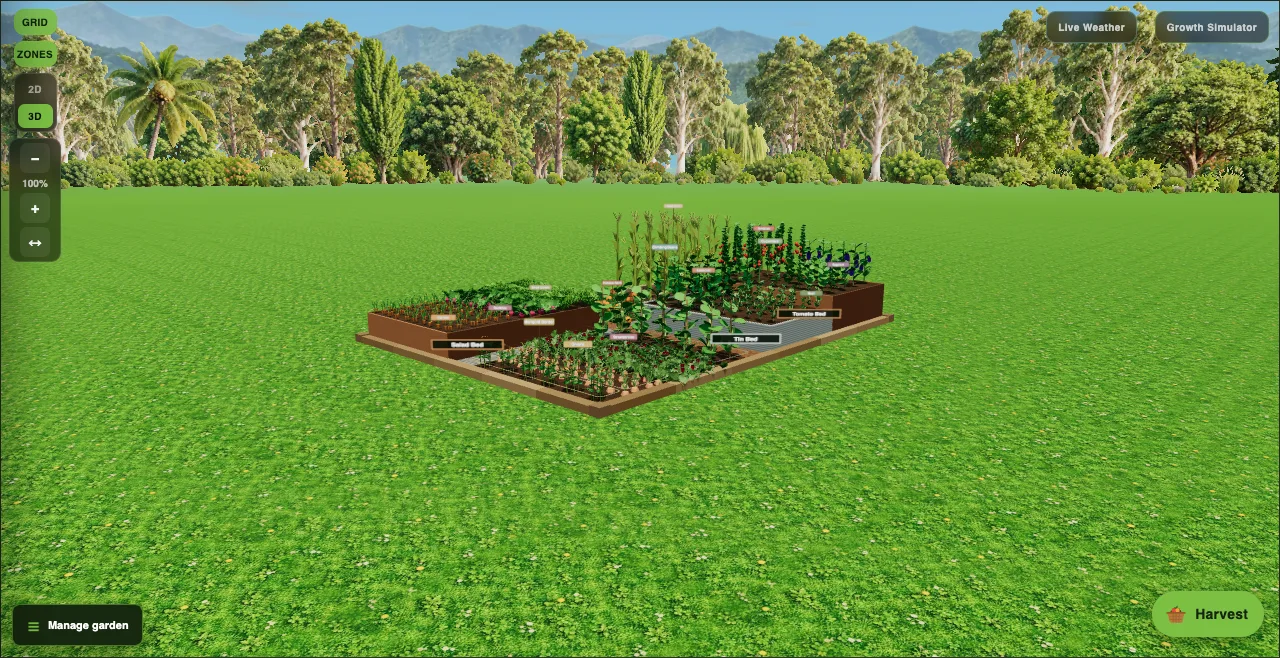
We have been busy in the garden this week. Here is what is new in Plotera, the free garden planner, and how it helps you grow more.
A 3D garden that feels like a real place
Open any garden in 3D and it now sits in a clearing, ringed by trees with mountains in the distance. The trees match your climate: palms and gums in the tropics and subtropics, more pines and birches in cooler places.
The scenery follows Live Weather. Cloudy days look grey and soft, sunsets glow orange, nights go dark, snow settles on the trees and peaks, and on a windy day you will see the odd swirl of air and a leaf tumbling past. Older phones automatically use a lighter version so the view stays smooth.
Harvest charts in the Yield Log
The Yield Log now shows how much you have picked, month by month, with a chart you can switch between weight, number of harvests and value. A crop ranking shows what is pulling its weight, and you can compare this year with last year. Filter by month, crop or garden, and export everything as a spreadsheet.
Logging a harvest is quicker too: enter a number and pick kg, g, items or bunches, so your totals add up properly.
Soil tests, simplified
The Soil Centre now has two tests instead of three: a Quick check that takes a couple of minutes, and an Advanced profile you can complete step by step, or simply type in results you already have. Did a pH test? Tap Add pH reading on your soil profile and you are done; earlier readings are kept so you can see the trend.
New to soil testing? Our soil pH guide explains what your reading means for vegetables.
Smaller improvements
- A clear Harvest button with a basket replaces the old carrot icon.
- Forms that need a garden now ask which one, instead of guessing.
- A fresh new look for the sign-in screen and loading screen.
Plotera is free on the web, Android and iPhone. Start planning your garden.